Inventory Planner
The Arkieva Inventory Planner (IP) supports sustained inventory reductions by providing a comprehensive view of how stocks are serving customer demand. The Inventory Planner is closely linked with the Demand Planner and the Supply Planner. Reports and warnings identify areas of alignment and areas of potential trouble.
- Identifies stocking points with inventory balances not justified by demand, demand variability, or historical supply needs.
- Calculates optimal safety stock balances at SKU and location level.
- Allows creation of numerous, flexible inventory metrics (e.g., days’ supply, inventory turns, inventory velocity, effective service levels).\ Days’ Supply is calculated by dividing the current inventory by average daily demand. If the average daily demand is based on history, then it is days of supply based on history.\ Inventory turns is calculated by dividing 365 by days’ supply. This is a physical inventory turn calculation as opposed to a financial one.\ Inventory Velocity is calculated as a percentage. At a particular number of days out in the future, what percentage of inventory is consumed? This is usually calculated in 10-day increments, i.e, day 10, 20, 30 ,40 days etc.\ Effective Service level is calculated by reporting historical service levels, if available. Usually, this data is not available.
- Identifies accumulations of obsolete or off-spec inventories that should be aggressively reduced.\ Obsolete inventory can have multiple definitions: A field marked as such in the ERP system data feed of the inventory file, Inventory of product identified as obsolete, and Inventory of product that has stopped selling (based on analysis of demand in Arkieva).\ Off-spec inventory is defined based on a similar field from the ERP system.
- Provides graphical as well as tabular representation of inventory over time, by aggregation over any product attribute, e.g., by product family, warehouse, inventory type (raw, semi-finished, finished product).\ History: If data is available, Arkieva will show the historical progression of inventory by time.\ Forecast: If Arkieva supply planner is used, Arkieva will show the future projected of inventory by time.
- Enables batch or lot-level reporting for aging analysis, remaining shelf-life, etc.\ If the inventory is available by lot level, and shelf life data is available, inventory planner can report on the aging and remaining shelf life.
Making Overrides and Changes
After downloading the data, the user can now edit and make overrides to values in the Scenario Parameters tab. These changes can be made globally across all inputs in the High Level section of the tab, or to individual inputs and values in the Detail section of the tab.
The High Level section shows the high level attributes and their values.

High level Value Overrides
The High Level section shows the high level attributes and their values.
In the example below, we have a warning showing the Desired Service Level values are not between 50 and 99.9999.

Clicking inside the Desired Service Level column in the High Level Section and typing a value will override all rows in the Detail section. The values in the row that you have overridden in the High Level and Detail section will be highlighted in bold to indicate they have not been applied. Clicking Apply Changes will propagate the overrides across the Detail level.

The Desired Service Level in the Detail level section will override to 95 and the cells will highlight in orange to show an override has been applied.
Overrides can be removed after applying them by right-clicking a cell or cells with an override and selecting Remove Override(s) from the right-click menu.

The user will be asked if they want to remove the overrides; click yes to remove the override(s). The user will be asked to re-download the data again to recalculate the data. The user will be warned to re-download and recalculate the data when an override is removed. Click Download Data, then save the IP by clicking the save icon in the Arkieva Toolbar.
The Save Changes window will launch. Click Yes.
The Download Data Warning window will launch. The user will be warned that if they click Yes, any existing overrides will be retained and saved to the scenario, clicking No will reset the scenario to its original values.

High Level Variance Overrides\ A user can also change the variance globally across the Detail level from the High Level. For example, using the dropdown under Demand Variance, a user can change the AA SOP Family ABC Product Shipto from Standard Forecast Variance to Modified Forecast Variance from the column dropdown. Click Apply Changes, and the Demand Variance column cells will highlight in orange to show these changes.

Detail Level Overrides\ Detail Level overrides and changes function the same way, except that these overrides are made to individual items rather than globally.

Select multiple cells and right-click to access Adjust Values to override multiple values.


Invalid Warnings
Arkieva IP will warn the user of any rules that might have been violated by any changes or overrides applied by the user.

Hovering the mouse over the red circle exclamation point next to the word Detail will show a tooltip with the amount of records that have invalid values; i.e. ’26 records have invalid Desired Service Level values’.

And hovering the mouse pointer over any red circle exclamation point within the Detail level grid will show what the violation is; i.e. ‘Lead Time Probability must be between 0 and 100’.
And if a user tries to Run the IP before fixing any errors, Arkieva will warn the user:


Run Calculations
After making any overrides and changes to the Scenario Parameters tab values, click the Run button to calculate these changes.

When the calculations are finished, the results will launch in the Reports tab.

Configuration and Tools
- Model: Houses the Configuration, Download Data, Run, and Publish Results buttons.
- Tools: houses the Filter, Export, Adjust Values, and Sensitivity Analysis buttons.
- Data: Toggle Input Data and Model Data reports on and off with these buttons.
- Settings: Global Defaults and Custom Methods.
- Reports: Create custom reports to create unique combinations of data without having to edit the Detail Report.

Model
The Model section houses the Configuration, Download Data, Run, and Publish Results buttons.
.png")
Configuration\ Open the Model Configuration window to edit or make a new Inventory Plan.

🚧 Warning
Attributes are not editable after you Download the Data.
Download Data\ When all sources are selected in the configuration tab and all overrides are removed in the Scenario Parameters Tab, the user can click the Download Data button to download all necessary input data that are needed to run the Inventory Planner.

Run\ Click Run after making changes to the Inventory Plan in the various tabs and sections of the plan. Running the plan will process the downloaded data for Publishing.

Whenever any changes or overrides are made in the Scenario Parameters tab, a yellow triangle exclamation point warning will appear inside the Run button to warn the user to Run the scenario again before they can view the results in the Reports tab.


Publish Results\ Publish changes and overrides back to the scenario to make them available for other users.

Tools
The Tools section houses the Filter, Export, Adjust Values, and Sensitivity Analysis buttons.

Filter\ Click the Filter button to launch the Basic Filter View window. Use filtering to drilldown the Detail section of the Scenario Parameters tab.


Export\ When viewing data in the Reports tab, the Export button will become active. When clicking the Export button, The Summary, Filter Selection, and Chart images will all be exported to Excel.


Adjust Values\ Activated when clicking inside a quantity cell (i.e. in the Scenario Parameters Detail Lead Time column); use this to adjust values by function and value.
Select a Function from the dropdown and type a Value to adjust to. Click OK. You can also select cells in the Detail section and right-click to Adjust Values.

Sensitivity Analysis\ Click the Sensitivity Analysis button in the Tools section to launch the Sensitivity Analysis window.\ Using the Sensitivity Analysis, a simulation of the calculations will be made when the lead time or the forecast error would deviate from the downloaded values.


Data
Toggle Input Data and Model Data reports on and off with these buttons.

Input Data\ Toggle the Input Data button to launch the Input Data table tab; the Table ribbon will also launch. The Input Data tab will show the non-time dependent data configured in the Model Configuration window.


Model Data\ Toggle the Model Detail tab on to see the historical demand and the forecast input data that is being calculated for the IP. The Model Data will be available if a workbench was selected in the Configuration Model window from the Demand Data Workbench dropdown.

In this example, the below Model Data report shows the Product and Location attributes, and the forecast and shipments data for those combinations.

The Model Data tab cannot be edited, however specific right-click options can be selected depending on how the IP was configured. This specific IP has Unit Conversions rules set, making the Unit Conversion right-click option available. A user can also export the Model Data to Excel by right-clicking and clicking Export to Excel.
Custom Reports
Create a custom report to create unique combinations of data without having to edit the Detail Report. Create custom reports by using the Reports section’s Create, Save Report, and Save Report As buttons.

Clicking Create will launch a tab containing the Quick Reports Design View; click and drag the desired attributes and quantities to create a custom quick report.
When finished, click Save Report to save the Quick Report under the Custom Reports section of the Reports Tab navigation.


Reports tab
After clicking the Run button in the Configuration and Tools ribbon, the IP reports will become available. The reports are separated into two folders: Standard Reports (Summary, Summary Analysis, Pie Matrix, Detail, and Sensitivity Analysis) and Custom Reports (created by the user).
The Results ribbon will also become available as a separate tab from the Configuration and Tools ribbon. The Results ribbon functions like the Quick Reports ribbon. Please read the Quick Reports documentation for more explanation on these features.
Click a report item in the reports navigation to launch a report.
- Report Navigation: View Report Outputs, Summary. and Summary Analysis.
- Summary report tab: high level view of high level grouping selections.
- Summary Analysis report tab: Color coded report highlighting the current stock.
- Pie Matrix report tab: Shows at a high level every single family for the safety and target stock.
- Detail report tab: Create a Quick Report.
- Sensitivity Analysis report tab: Create sensitivity analysis iterations.

Report Navigation
Report Outputs\ Report outputs are populated by the selections made in the Model Configuration.

- High Level Grouping: is defined by the High Level Grouping selection in the Model Configuration Attribute section.
- Product: is defined by the Item selected in the Model Configuration attributes section.
- Location: is defined by the Location selection in the Model Configuration attributes section.
- Customer Type: is defined by the Customer Type selection in the Model Configuration attributes section.
The following are the expressions that calculate the rest of the columns that populate from the selections made in the Model Configuration.
- Safety Stock Value: SUM([Safety Stock Units] * [Standard Cost])
- Target Stock Value: SUM((([Lot Size] / 2) + [Safety Stock Units]) * [Standard Cost])
- Cycle Stock Value: SUM(Lot Size)/2 * Standard Cost
- Current Stock Value: SUM([Current Stock Units] * [Standard Cost])
- Safety Stock Units: Total Safety Stock Units SUM([Safety Stock Units]), Average Safety Stock Units AVERAGE([Safety Stock Units]), Minimum Safety Stock Units MIN([Safety Stock Units]), Maximum Safety Stock Units MAX([Safety Stock Units])
- Target Stock Units: SUM(([Lot Size] / 2) + [Safety Stock Units])
- Cycle Stock Units: SUM(Lot Size)/2
- Current Stock Units: Total Current Stock Units SUM([Current Stock Units]), Average Current Stock Units AVERAGE([Current Stock Units]), Minimum Current Stock Units MIN([Current Stock Units]), Maximum Current Stock Units MAX([Current Stock Units])
Report filter (Summary and Summary Analysis)\ The report output columns in Summary and Summary Analysis can be filtered by clicking the down arrow and checking the filter checkboxes.

Right-click menu\ Each report has right-click options that can be used to manipulate the way the data is viewed.
Graph right-click menu (Summary, Pie Matrix, and Detail reports)
- Enable Zoom: enable the option to zoom in and out of the graph
- Reset Zoom: reset the zoom to neutral
- Export to Excel: Export the graph to Excel
- Export to PowerPoint: export the graph to PowerPoint
- Copy to Clipboard: copy the graph to the clipboard to be able to paste it elsewhere
- Save to file: save the graph as a file; i.e. a .jpeg

Grid right-click (Summary, Summary Analysis, and Detail)
- Sort: sort the order of the data in the grid
- Refresh: refresh the data
- Export to Excel: export the grid to Excel
- Show Tooltip: toggle tooltips on or off
- Drilldown: Configure context sensitive drilldowns for the grid data, which can be used to launch another report in a pop-out window. The drilldown documents are context sensitive, meaning that the level a document is placed within the table will be reflected in the drilldown document if they are both table documents. A user can also drilldown to another document type, such as a Workbench or a Quick Report
- Modify frozen columns: freeze and/or unfreeze the grid columns. Frozen columns stay stationary while scrolling through a large set of data.

Summary report tab
Gives a high level view of the high level grouping selected in the configuration model.

Summary Analysis report tab
Shows a color coded report highlighting the current stock as compared to the target/cycle/safety stock based on certain conditions set in the conditional formatting. Conditions can be set comparing the target columns to other columns within the report or by custom expressions.


Pie Matrix report tab
The Pie Matrix tab shows at a high level every single family for the safety and target stock. Hover the mouse over the pie graphs to display tool tips showing values.

Detail report tab
Create a Quick Report by dragging attributes to the filter section, and selecting a filter. Contains all material and plant high level grouping, and the target stock days, units, and values.


Sensitivity Analysis report tab
There are two variabilities that lead to the safety stock: Supply Side Variability and Demand Side Variability.
- Example: If there is more variability, we must hold more safety stock because we are uncertain of when we will get the material or uncertain of how much the demand will be. This tool allows for a user to try different sensitivities to create different scenarios. A user can reduce variabilities to see how to plan for safety stock.
Creating Iterations\ Click the Sensitivity Analysis button in the Tools section to launch the Sensitivity Analysis window.

Check the Perform Sensitivity Analysis checkbox, and make selections based on Lead Time Step, Forecast Error Step, and Number of Steps.

Below shows a reduction of 2% on the forecast error step run over 10 steps, i.e. decreasing the forecast error by 2%, 4%, 6%, etc., until the safety stock is reduced. Click OK.

Run the plan.


These iterations can then be selected in the filter view for reports.

Scenario Detail report
In addition to the Detail Report, a new Scenario Detail Report has been added to the Reports tab. The Scenario Detail report will filter to the current scenario by default, whereas the Detail report opens with the manual filter options first.
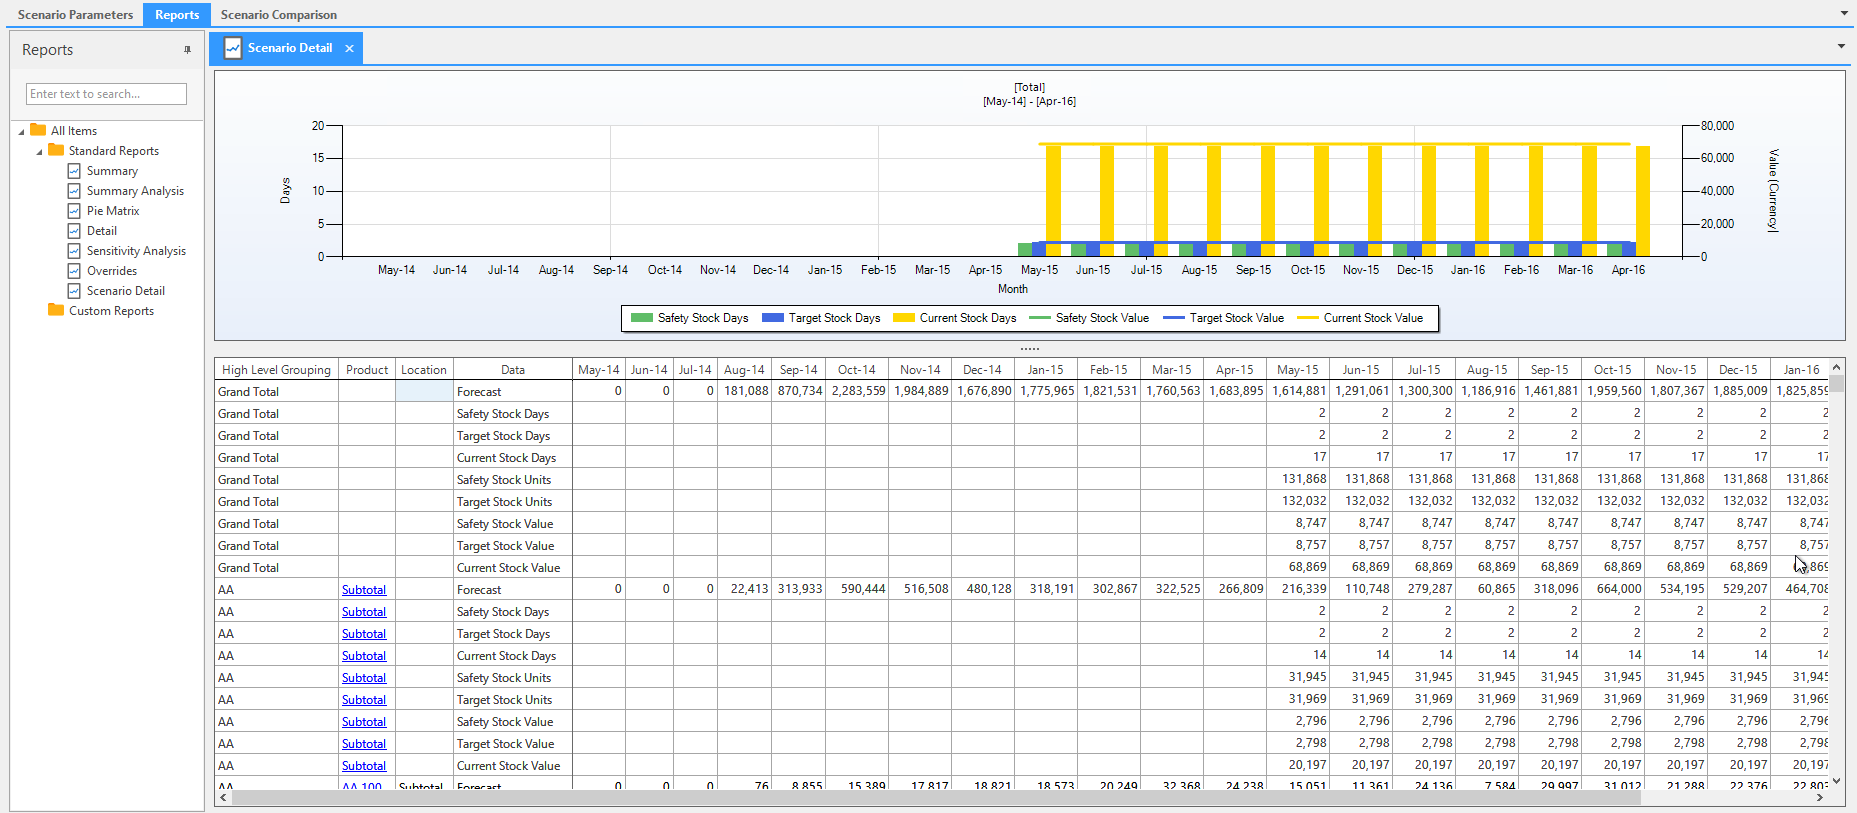
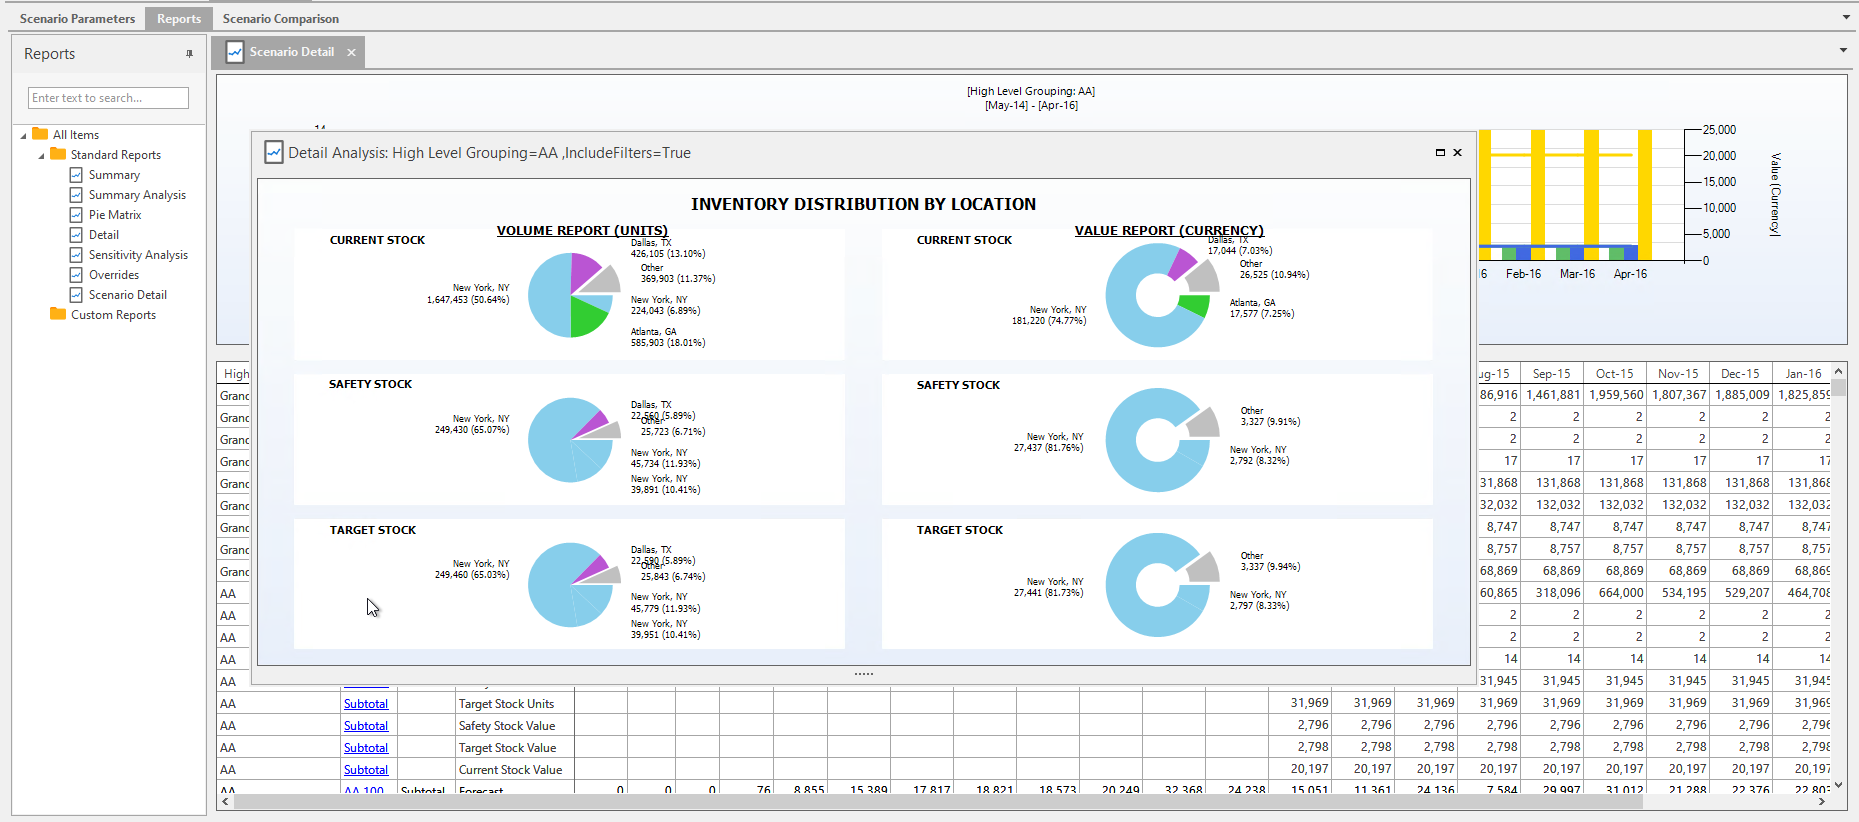
You can also CTRL + Click the Subtotal links to view a subtotal Detail Analysis.
Scenario Comparison
Multiple Scenarios can be created to compare against the Base Scenario. These multiple scenarios can then be selected when launching the IP document. Access the Scenario Management window from the toolbar. Click the Scenario button.


Click Create to make another scenario that can be compared to the base scenario.

Type a name for the scenario, and an optional description and ID number. From the dropdown select the scenario that the new scenario will be created from and the type of scenario. Click OK to create the new scenario.

Click the Scenarios button to launch the Scenario Comparison Selection window.

Click an Available Scenario and move it to the Scenarios to compare section with the arrow buttons. Select multiple scenarios to compare in the Scenario Comparison tab.

Use the Data Filter toggle buttons to switch between Safety Stock data and Target data.
Safety Stock
Target
Scenarios can also be selected in the filter section to be compared against each other in the Detail report.

Understanding Safety Stock & Target Stock Calculations
Learn to calculate safety stock and other inventory targets in Arkieva.
{`
`}
Related Articles
Replenishment Planner
The Replenishment Planner is a multi-echelon planning solution that ensures that the right quantity and mix of products are shipped to the right location, at the right time. The Replenishment Planner uses a proprietary, sequential rule-based ...Financial Planner
Introduction Increasingly, our customers would like to tie-in financial metrics to their operational plans. To accomplish this, we have incorporated strategic benchmarking into the Arkieva platform so that we can design the operational supply chain ...Inventory Definitions
Basic Definitions Standard Deviation Used to quantify the amount of variation of a set of data values from its mean. Where,\ σ = Standard Deviation\ Xi = Data observations\ µ = Mean of Xi observations\ N = Number of observations if number of ...Inventory Planning Introduction
Arkieva’s sophisticated analysis tools and safety stock reports enable planners to identify inventory issues and to make informed decisions concerning this delicate inventory balancing act. Our Inventory Planner utilizes demand data to plan safety ...Inventory Management
Basics of Inventory This inventory basics video will help you understand inventory management frameworks. We will help you think about inventory policies, whether something is made to stock or whether something is lean / agile, and what kind of ...