Promotion Planning
Introduction
Running promotions to increase sales is an essential part of the product marketing process. The Arkieva Promotions Planner provides powerful forecasting analytics tools that help you quickly align your promotions with your demand or supply. Discover which promotions yield the best return on investment and create an improved forecast that avoids overstocks or understocks using what-if- scenario analysis to help you better prepare for different situations.
Arkieva Promotions Optimization Process\ Promotions optimization throughout the entire Promotions Planning Process.
Promotions Planning:
- Initial promotion creation and determination.
Promotional Approval:
- Determine if the proposed promotion fits with budget and business strategy.
Promotional Confirmation:
- Agree to put promotion into action based on group recommendation.
- Deliver promotion based on agreed duration, medium, channels, and marketing tactics.
Promotional Planning Review:
- Analyze actual sales, compare to planned production volume and make adjustments.
- Analyze actual revenue impact vs. budget.
Managing the future impact of upcoming promotions
Managing the future impact of upcoming promotions through Arkieva.
{`
`}
Launching Promotion Plan
Access the Promotion Planner component from the New Items dropdown in the Home Ribbon.

Save Promotion Plan document
The Save window will open after selecting Promotion Planner. Create a name for the Promotion Planner document. You can also click Show Advanced to optionally select security permissions for the Promotion Planner document. Click OK.

Configure Data
After clicking OK, the Configure Data window will open. This is the Promotion Planner wizard for selecting filter conditions, mapping attributes, and selecting displayed data. From the dropdown, select a Data Constellation. After selecting the data constellation, you can apply filter conditions for the promotion plan data.

Next, click Map Attributes. From the dropdowns, select source data to map to the attributes of the Data Constellation selected.
📘 Note
Only quantities that created under primary star will be available as source data in mapping attribute dialog.
📘 Standard Cost and Standard Price
For Standard Cost and Standard Price, the following steps must be completed before Configure Data will allow you to proceed.
- In SQL, Create two columns ‘Standard_price’ and ‘Standard_cost’ in Product's input data table, Set data type as decimal(29,4) and populate data.
- In the setup manager, create two attributes ‘Standard_price’ and ‘Standard_cost’. Set data type as decimal(29,4).
- Next, add these attributes in product/item dimension as dependent attributes.
- Generate system model and run load constellation.
❗️ Correctly mapping Attributes is required
The Red Checkmark will turn to Green when all attributes are mapped. You will not be able to continue to the Promotion Plan document if the attributes are not mapped correctly.
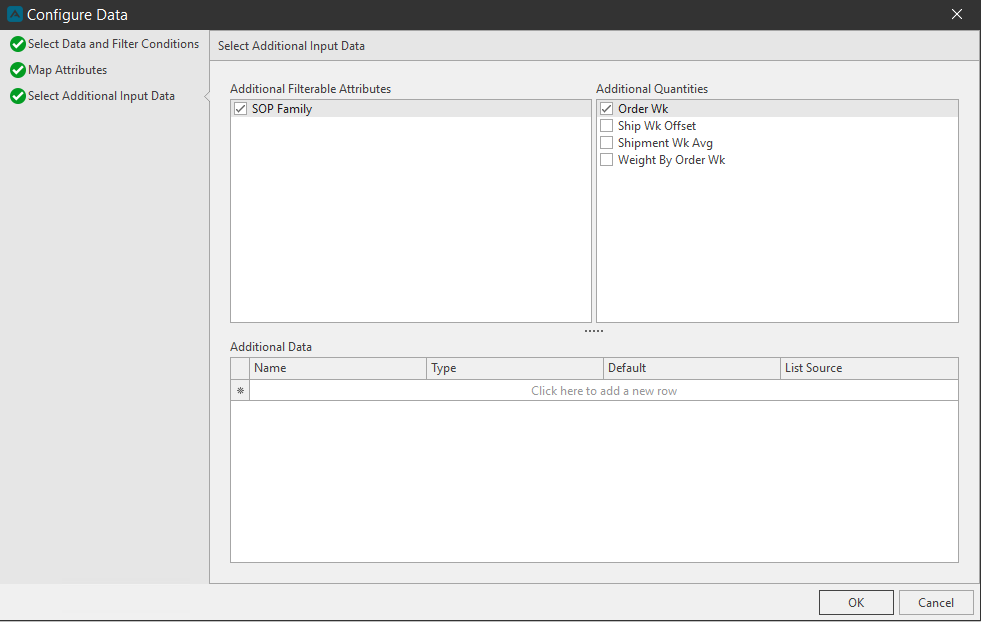
After mapping the attributes, you can optionally select additional input data. Check additional attributes and quantities to include in the filter window and the Workbench. note that this step is not mandatory. Click OK to close the Configure Data wizard.

📘 Create additional data type fields for events and new data source for Dashboard
By creating additional fields under the Additional Data section of the Select Additional Input Data tab of the Configure Data window, users can then edit these additional data fields in the Edit Event window. Additional fields can also be added with or without a source table.
User can now create 10 each of the following data type fields: String, Numeric, Boolean, and Date. Note that only the data in the first column of the source table will be reflected in the Additional Data tab.
After creating Additional fields in Configuration Data window, these fields will be available in the Edit Event window under the Additional Data tab. User can then edit this data and these changes will be saved to the Event Table. These additional fields will also be available in the event tab grid; right-click a column in the grid and click Column Chooser to launch the Customization box of additional columns. Then click and drag the columns to the grid to display these Additional Data columns.
👍 Download Data
The Download Data window will popup asking if you would like to download the configure data now for the promotion plan. Click yes to download the data. Clicking No will launch the promotion plan without the configured data. You can however click the Download Data button in the promotion plan ribbon to download the configure data.

Download Data
Download the data that you have configured in the wizard. You must download the data before you can create promotion campaigns, events, and product profiles. Click the Download Data button located in the Settings section.

Click OK after the input data download is complete.

Data Filter
The Data Filter drawer has been added to the Events tab of the Promotion Planner. Selecting items to filter in this window will reflect what is selected in the Event Table.
Optionally, you can refresh filter selections manually or have the selections auto-refresh in the Event Table.
Campaigns
To create a new promotion plan, click the New Campaign button from the home ribbon. Campaigns must be created first before a new Event can be added.

Click the Campaign button located in the ribbon to launch the Manage Campaigns window. Click Add to create a new Campaign. Type a name for the Campaign and click OK.

The new campaign will appear in the Campaigns dropdown list in the New Promotion Event window.

Strategies
Strategies can be used to name upcoming promotional events with preset and user created strategy names.

Default Strategies include BOGO (Buy One, Get One), Coupon, Discount Pricing, Flash Sale, Limited Edition, Marketing Campaign, and NPI (New Product Introduction).

Product Profiles
A Product Profile is a list of products that you will select for a Campaign’s Promotional Event. After creating a Campaign(s), you can create a Product Profile anytime after downloading data. Click the New Product Profile button to launch the Product Profile window.

Type a name for the Product Profile.
Click the Edit link in the Promoted Products section of the Manage Product Profiles window to select what products to include in the Product Profile. Clicking Edit will launch the Product Filter window.

Double-click an attribute to select to populate the filter items. Click product items to filter and click Select. Click OK after selecting products.

iltered items will be listed in the Product Filter box. You can also select what products will be cannibalized by the promotion by clicking the Edit link in the Cannibalized Products section. Unit Cost and Unit Price are also editable. Edit the price to represent the planned discount. Overridden values save individually for product profile.
Click OK when finished creating the Product Profile. The new product profile will be available in the New Promotion Event Product Page 2 Product Details Product Profile dropdown.

Dashboard
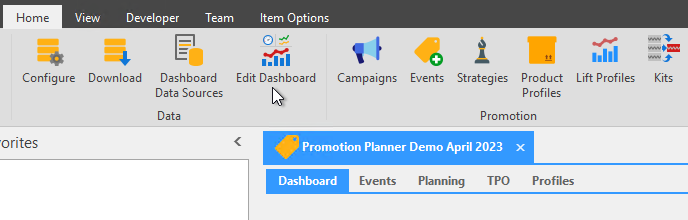
Create a dashboard for the Promotion in the Dashboard tab. Click the Dashboard Data Sources button to launch the Select Data Sources window and check what sources to use for the dashboard.


Next click the Edit Dashboard button to launch the Dashboard Designer Dialog window.


TPO
The TPO tab holds a collection of all TPO analysis that were run.
You can use TPO to run historical analysis to find the relationship between products. Use TPO tools like event analysis to gain insights and save lift profiles for use with future events.

TPO Analysis
TPO Analysis button allows you to run the same type of analysis shown without a preexisting event defined. You can select any two period ranges, any product profiles, and any customer filter to run the analysis.


TPO Event Analysis
Click the TPO Event Analysis button to launch the Create TPO Comparison from an Event window.


In this example we will select the Event '½ Price Sports Drinks' from the Event dropdown. The Promotion Start date is 3/11/2018. Notice under the Quick History View tab the chart shows time series data with a two-week spike in demand in March 2018.
Under the Comparison Start date we have chosen 2/11/2018. This is our period of stable demand for the tool to compare to.

Next we will go to the Comparison Results tab.

The Comparison Results Chart shows the event periods in the area of the chart with a white background and the same number of periods before and after the promotion. The orange series represents the promotion while the blue bars represent the demand during the comparison window.

The Table to the left of the chart corresponds to the promotion periods (white background); in this case 2 weeks. The Table is split into three sections: Promoted Items, Cannibalized Items, and Net Effect.
Under the Promoted Items section we see 6,300 units compared to 3,000 units of demand in the comparison period. This is a bit more than double.
- Represented as a lift %: 110% over base demand
- Represented as a lift number or multiplier: 2.10
Under the Cannibalized Items section we see 9,500 units compared to 10,000 units of demand in the comparison period.
- During this event, 500 less units were sold, or 5% cannibalization effect.
Under the Net Effect section we try to see the total effect of running this event. Adding together both previous two sections (Promoted, Cannibalized).
- In this case, + 21% lift. (Lower because most of the volume on the bottle water).

Show Revenue Toggle
Check the Show Revenue Toggle checkbox to see the Revenue effect f the historical promotion over the base demand. When toggled off, the volume lift of a historical promotion will be over the base demand.

Under the Promoted Items section we'll see the lift comparing revenue is still positive. But much less then that of the volume comparison. The reason being we are running a 50% price discount for the promotion. The base unit price for these items is $3.50 and for this promotion we cut the price to $1.75. We will basically break even.
Under the Net Effect section we will see there is a negative (-) total effect. This means we sold close to 3,000 more units, but our revenue decreased slightly.
We must determine what the goal of the promotion was to classify it as a success or failure:
- Was it to move obsolete inventory?
- Was it to gain a competitor’s market share… gain popularity for our products?
- Or to increase revenue? On that basis we could conclude our price decrease did not increase volume sales enough to boost revenue.
Click the Save Comparison button to save the Event Analysis. Click the X to exit the window and go back to the Promotions Dashboard.
Predict Volume and Lift
A planner can use Predict Volume and Lift to analyze past events and calculate lift. Predict Volume and Lift uses a proprietary algorithm that analyzes the full history data set for events and calculates the average lift over the base demand.
Click the Predict Volume and Lift button to launch the Predict Volume and Lift window.

Click the Display History button to launch a pop-out quick history view.

These results will be automatically saved to the TPO tab.

Review the TPO tab. Click the Save Lift button to save the Lift data.

After saving the Lift Profile is will be available to assign to Events.

After creating a baseline lift profile with the Optimization TPO and Predict Volume and Lift tools, we can now view and assign lift profiles to our events.
Click the Lift Profile button to launch the Add/Delete Promotion Lift Profile window.

From the left side of the window, select a profile from the list. Notice that the Period and Cannibalization effects are captured.

To assign lift to an Event, go to the Event tab and select an event. From the Edit pane, select the Lift Details tab and select the Lift Profile from the dropdown list.

Planning
Users can fine tune the plan at the most granular level (Product, Customer, Week). Users can run what-if analysis on the Promotion Volume Forecast, Price, and Cost and see the impact on Margin and ROI. To move forward with the Promotion a user changes the status of the event to escalate it in the approval process.
Planning Workbench
Click the Navigation button to slide out the navigation pane. Here you can select a Campaign and Event, and reorganize and add attributes levels.
Restore Defaults\ When making changes to the lift profile, click the Restore Defaults button to fetch the data and refresh the lift profile.
Refresh Forecast\ After making changes to an Event, like adding or removing attribute levels, click the Refresh Forecast to fetch the data for any newly added fields (time period/customer/products).

Configuration and Default View checkbox\ There are multiple fields available which can be configured in the Configuration window to preform more in-depth analysis in the workbench. Add these fields to the workbench by selecting them in the Configuration window.
Uncheck the Default View checkbox to view the fields you've selected in the Configuration window. The Default View checkbox is checked by default.

Configuration buttons and columns:
- ROI/Measure Objects toggle: Toggle the ROI toggle button to choose to add fields to the Volume grid or ROI.
- Model Object: you can select the different available fields from the dropdown menus in the rows under the Model Object column.
- Caption: when selecting a field the caption will be created automatically, but you can change the caption by double-clicking inside the caption cell.
- Expression: You can create an expression when selecting the Expression field under the Model Objects column.
- Format: By default format will be n0, however you can change this.
- Hidden: When checked the field will be hidden in the workbench.
- Hierarchy View: User can select any or all options to see selected field when selected from workbench navigation: Event, Promo, Canni.
- Show in chart: checked by default; shows the field in the chart.
- Color: select different color to see in the chart. No color is selected by default.
Expression\ In Model object column the first option is Expression. When selected you can create an expression under the Expression column. Click on the ellipses (…) in the Expression column to open the Expression editor.

📘 Note
Expressions will be available in the non default view only. Uncheck the check box for default view in workbench.
ROI\ Toggle ROI on to show the margin and ROI or return of doing completing this promotion Vs. not completing this promotion. You can run additional What-If scenarios by updating the Price/Cost and seeing the effect on the Margin.

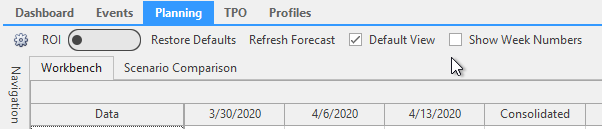
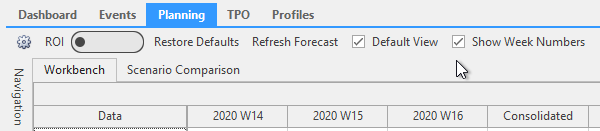
Show Week Numbers in Planning tab
Toggle on or off Week numbers for the Workbench in the Planning tab.
Planning Scenario Compare
Allows the user to compare all the three scenarios.
- Base: Scenario if no event is done.
- Profile: Scenario built with a historical lift profile.
- Plan: Scenario after user has reviewed, tweaked, and is ready to commit to or escalate to next person in approval process.
Scenario Compare also lets the user see all the costs associated with event if you have fixed event costs or other things modeled. Planned will show you an increase or decrease in revenue. Event costs (Fixed and Variable) factored in.

Profiles
Shows a list view of the Lift and Product Profiles created.

Events
Creating a promotional event allows users to collaboratively plan an event, such as a sale, by imputing different types of costs, statuses, and selection of target customers.
You can create a New Promotional Event after creating Campaign(s) and Product Template(s).
To create a New Event, click the New Event button in the Promotion Planning ribbon. The New Promotional Event window will launch on Page 1.

Select a Campaign from the Campaign dropdown. Create a name for the Event in the Event Name field, and select an Event Start and End date from the calendar control dropdowns.
The Status dropdown is optional but useful for tracking the life-span of the event, such as editing the status to ‘Approved’ when a sales team approves the event. Click Next to go to Page 2.

On Page 2 select a Product Profile from the dropdown, or click the Green Plus button to launch the Manage Product Profiles window and create a new Product Profile. Selecting a Product Profile will populate its Product and Cannibalization data in the window. Click Next to go to Page 3.

On Page 3 you can optionally filter the promotion event for customers or channels. Click the Edit Customers or Channels link to launch the Customer Filter window.

Select Customer filter items and click OK.

The Customer filter data will show on page 3. Click Next to go to Page 4.

Optionally select a Lift Profile on Page 4. You can also create a Lift Profile by clicking the Green Plus button to launch the Add/Delete Promotion Lift Profile window. Click Finish.

Under the Events tab of the Promotion Plan the new Event will appear on the Calendar and under the Campaign section under the Calendar.

You can now edit the new Event by double-clicking the event under the Campaign section of double-clicking the event on the Calendar. Under the Edit section you can edit the Event's General information, Product Details, Lift Details, Cost Details, Subscribers, and Reminders.

General Tab\ In the General Tab you can edit the Event Name, Campaign, Start Date, End Date, Strategy, and Status.

You can also optionally set a picture icon for the Event by clicking the Change Picture link. Select an image you have saved and click Open to set that as the Event Picture.

Product Details\ From the Product Details tab you can select another Product Profile and Edit the Customer Profile filter.

Lift Details\ From the Lift Details tab you can select another Lift Profile.

Cost Details\ Here the user can assign additional costs that are event specific.
The Cost details are tied to the Volume fields in the General section of the Promotion Event Details section. Use the Cost Details section to document the type of Cost (Category), Fixed Cost, Variable Cost, Actual Cost, and a Description. Budget Cost is Budget Cost = Fixed Cost + (Variable cost * Volume) and is non-editable.

Escalate, Commit, and Publish Event
Once you are happy with the plan, go into the Event and change the status of the Event to Committed to signal to the rest of your team the promotion is ready to forecast.

In order to get the data back into the demand planning module, Consultant must configure a SQL procedure to publish the promotion forecast. A custom action button can be exposed in the ribbon of the module. Go to the Item Options ribbon and Press “Sync to Demand Planning” button.
Launch your Arkieva Workbench for Demand Planning Collaboration. Look for the Event Forecast row to confirm the forecast has exported.

Related Articles
Demand Planning
Segmentation Override Option for Segmentation Views Administrators are allowed access to everything in Segmentation Views (Allow Overrides, Allow Exception Flags, Edit Screen, Run, Share, etc.; however Users are only given access to Allow Overrides ...Supply Planning
One of the most critical tasks for any manufacturing organization is balancing assets (e.g., capacity, materials, people) with demand. Planners must determine how best to meet the demand given (1) available assets, (2) the production and distribution ...Demand Planning Introduction
The Demand Planner creates a collaborative demand planning process for a cross-functional demand planning process for working towards one common goal. Benefits of the Arkieva Demand Planner Solution: 15% less inventory 17% higher perfect order ...Planning Grid tab
Time Horizon The planning horizon is along the top of the Planning Grid spreadsheet. The planning horizon information is pulled from a table in Arkieva. You can view the table name by clicking a time bucket cell. Time Horizons can be different ...Supply Planning Introduction
One of the most critical tasks for any manufacturing organization is balancing assets (e.g., capacity, materials, people) with demand. Planners must determine how best to meet the demand given (1) available assets, (2) the production and distribution ...