Reports and Visualization
Table Editor
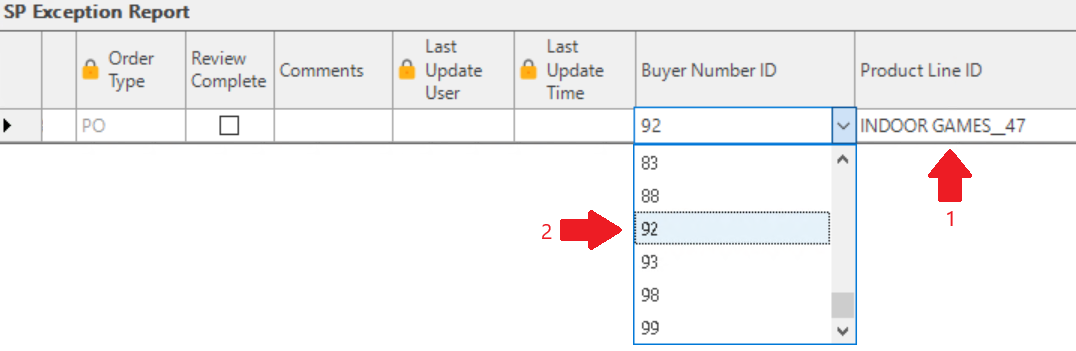
Ability to have a dynamic dropdown in a table editor
Users not have the ability to write a custom expression that enables a dropdown to filter its contents based on the value of another column. For example, the selection of 'INDOOR GAMES_47' will limit what the BUYER NUMBER ID dropdown displays so that only the relevant values are shown.
Ability to filter a dropdown using a substring
Previously, in a mapped column of a table editor, the user was able to start typing the name of an item and the filter would jump to the first match based on the 0th charindex value.
Now a user can type the string of characters generating a substring match for the dropdown contents. For example, if the dropdown was:
'aardvark'\ 'animal'\ 'amalgam'\ 'apple'\ 'malaria'
The user can now type in 'mal' and the dropdown would then show:\ 'animal'\ 'amalgam'\ 'malaria'\ Image
Text Wrap Function for the hover feature
Validation messages and user comment columns are typically near the end of the table editor, and can become large in content. The text hover display often goes off the end of the monitor.
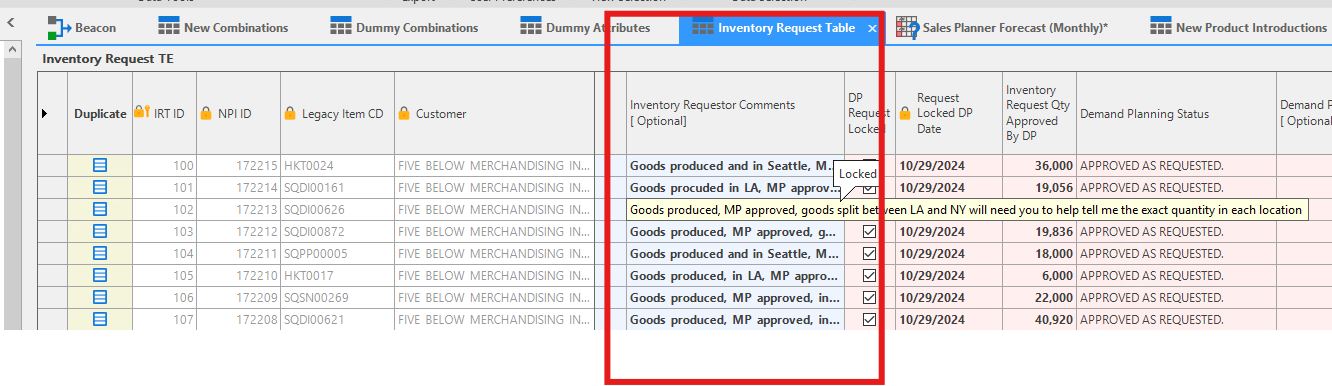
The hover text that appears in the table editor is now able to wrap so that it isn't so long and will now not go off the monitor.
Related Articles
Advanced Reports
❗️ Arkieva will no longer support newly created Advanced Reports Arkieva will only support Advanced Reports created prior to the 4.9 release. Introduction Create custom documents with the Advanced Reports component. Access Advanced Reports by ...Quick Reports
Introduction A Quick Report visually displays Data Model data into rows and columns of attributes and quantities. Design the Quick Report in the Design View, filter attributes in the Filter View, and view the data in the Results View. How to design a ...KPIs and Quick Reports
Building off Session #31, learn how to utilize the built-in functions to create KPIs within quick reports. {` `}Release Matrix
? Release Schedule Arkieva releases are quarterly: February, May, August, November. Demand Planning Feature 5.22 5.21 5.20 5.19 5.18 Anomaly Component Forecast Methods Machine Learning Link Promotion Planning Link Link Link Segmentation Link Link ...Analytics Dashboard
❗️ Warning: Exporting to Excel An error will occur preventing the exportation of the dashboard to Excel if any dashboard component is named with special characters followed by an apostrophe ('). Introduction The Arkieva Analytics Dashboard ...