Causal Forecasting
Causal methods
When time series methods use time series history to forecast the future, Causal forecasting methods factor for the time series data and external factors that would influence the forecast. The external factor(s) that influence the forecast are called Causal Factors. Causal factors that affect the forecast in a supply chain world are GDP, petrol prices, weather, stock market indicators, etc. As an example, a bullish stock market might be an indicator of increased sales.
How to define causal factor in Arkieva\ For all the causal regression methods to work, the causal factor should be defined first. The causal factor should be defined as quantities in the setup manager. While defining these quantities, it should be marked as Regression Factor in the usage column. Multiple quantities at a time can be marked as Regression factor.

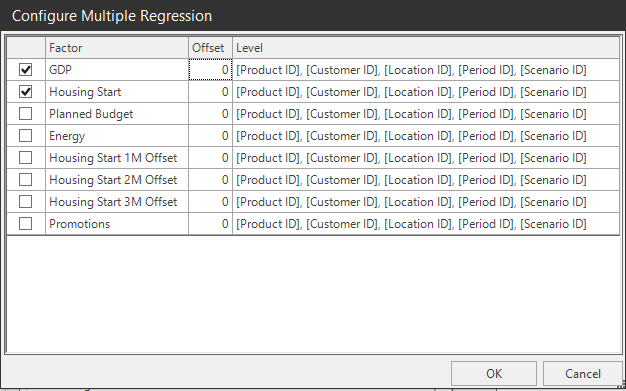
Once a causal method is selected in the method editor, the regression factors that were defined in the set up manager will be available in a popup window. Multiple quantities can be checked which will be considered while running the statistical forecast using that causal method.

The impact of the regression factor on the forecasted quantity can be offset using Offset factor which is available in the pop up window, resulting in the regression factor becoming a leading indicator. The offset value becomes important because the impact of a causal factor on the forecast value will not be immediate in most of the cases.
Alternately the offset value can be defined in the set up manager as shown below. Sum of both the offset values will be considered if it is defined using both the methods.

Regression
Regression analysis is a tool used in forecasting and financial analysis to predict future values based on the relationship between two or more pieces of data. In regression analysis, the dependent variable is the value that depends on the independent variable. The regression model uses historical data to estimate the value of the dependent variable for new or future observations of the independent variables. (Source: Google AI Overview)
Multiple Regression
Multiple Regression fits a set of mathematical formula or economic data to history and is used for Causal Forecasts.
To create a Multiple Regression report, you must activate trend parameter with a number greater than 0. When activated it would generate two factors, one a constant and the other a linear factor by using the index of the periods( e.g. 1,2,3 etc.), this allows it to include a linear trend.
Multiple regression with no trend
Multiple Regression with a trend factor
The formula chooses coefficients to multiply each row to achieve the best fit to the historical series. Each curve must contain a value (in case of mathematical formulas) or a forecast (in case of economic data) for each future time period. When this formula is used in the Demand module, the coefficients chosen are reported in the Coefficients tab under the Display Forecast Results button.
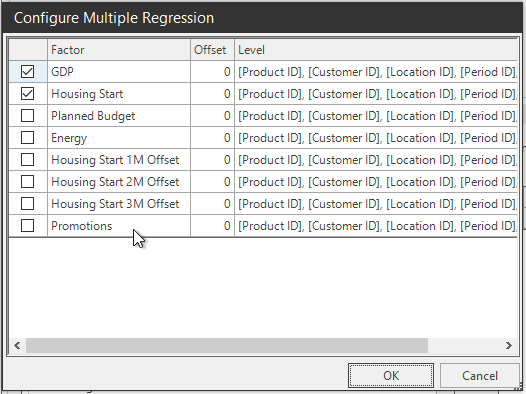
When selecting a custom multiple regression method or creating a new custom multiple regression method, there are parameters that need to be selected before the system can base a forecast on the historical data. These parameters are the causal data that have been recognized by planners and input into the Arkieva database.
- Check or uncheck different factors to configure the multiple regression parameter's causal data input for historical forecast.
- Change the Offset numerical value to affect the lead time or lag time of the multiple regression.
- Level shows any external indicators or factors related to the database housing the causal data.
The causal data is found in the Setup Manager under the Quantities tab, located under the Usage column.
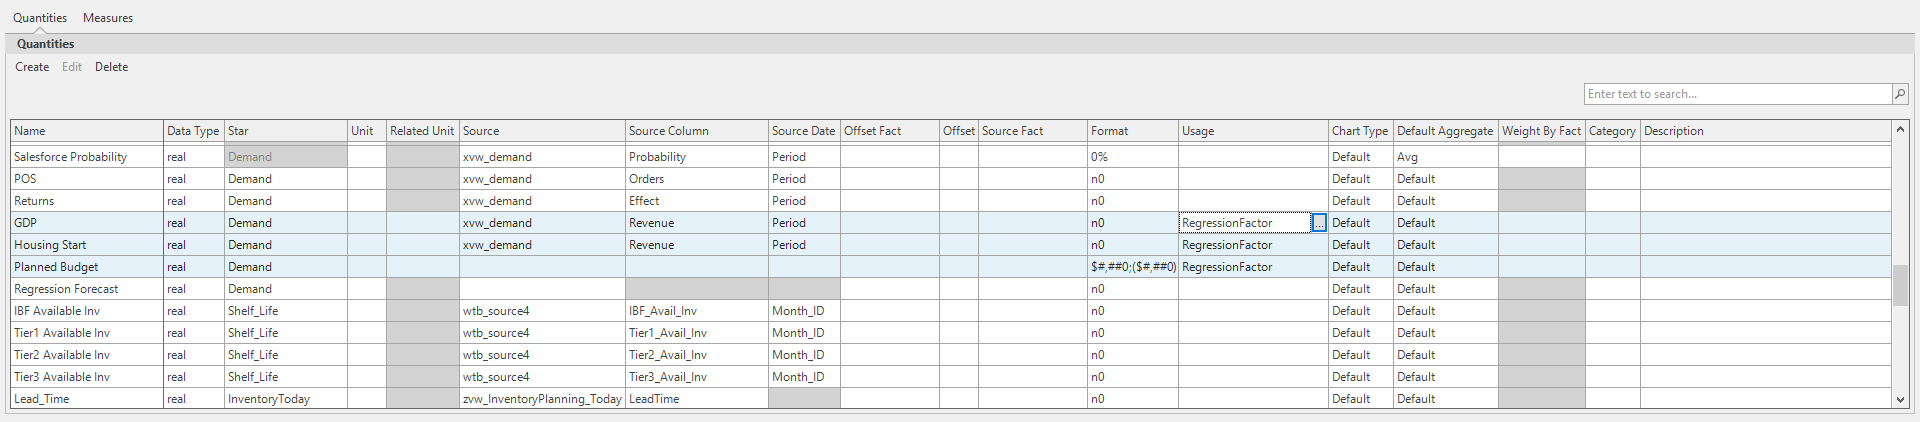
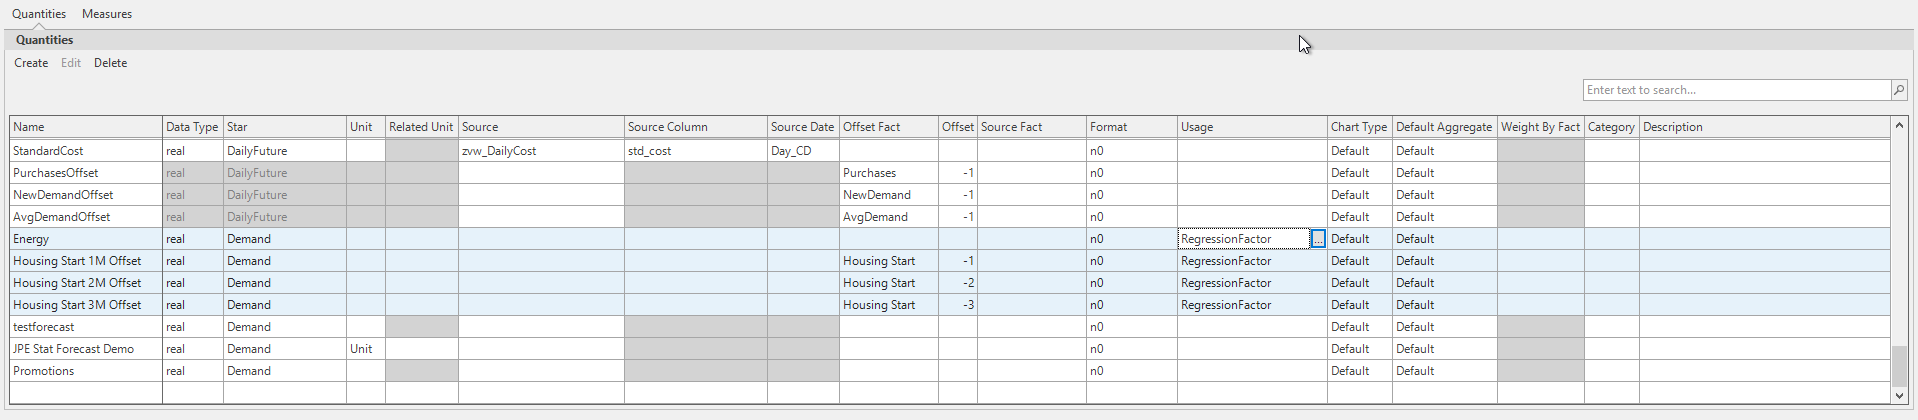
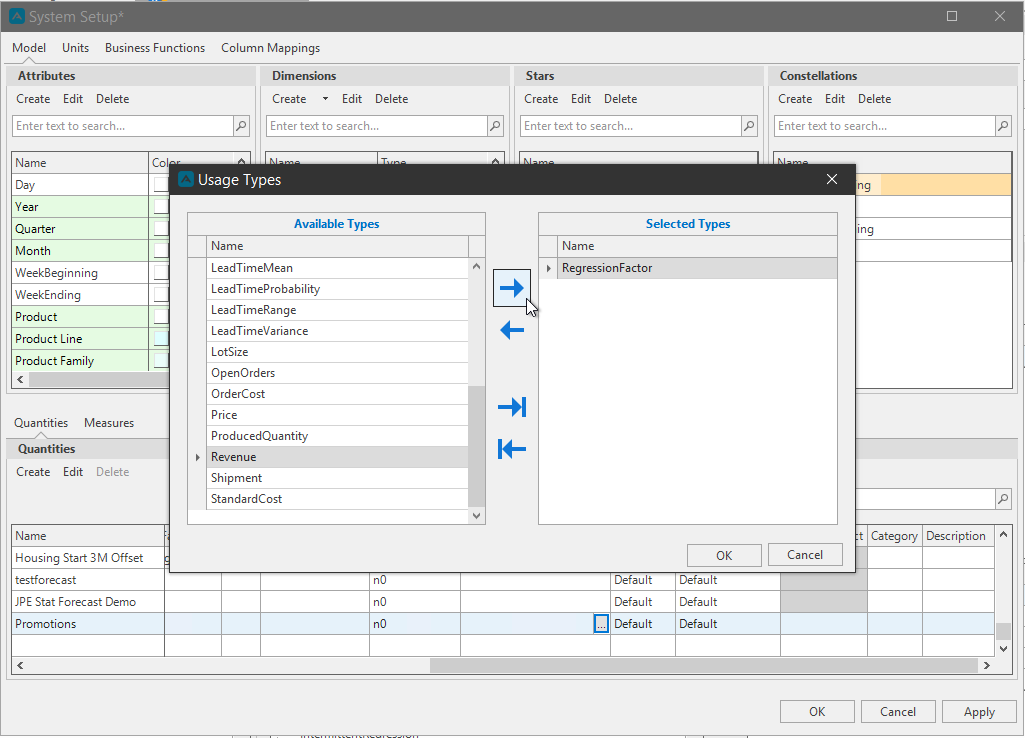
Add or remove other quantities from being selectable in multiple regression methods by clicking the ellipses button under the Usage Column and adding or removing the quantity to/from Regression Factor. After clicking Apply, the quantity will now appear in the Multiple Regression parameters.
Related Articles
Forecasting Terms
Time Series Any set of data which is described in terms of time. Examples: Corona Virus cases every day/week/month, etc. Sales of a smart phone over months/quarter, etc. Time Series forecasting Identifying patterns in the past and projecting them out ...Multiple Regression
Multiple regression is a statistical forecasting technique that uses multiple independent variables to predict the value of a dependent variable. Multiple regression allows for multiple predictor variables. Any prediction of the dependent variable ...Methodology
Arkieva has the flexibility to use multiple formulas in a forecasting method. It also gives configurable options to combine/compare the results of each formula and calculate a final forecasting result. When selecting more than one method, Arkieva ...Demand Planning Introduction
The Demand Planner creates a collaborative demand planning process for a cross-functional demand planning process for working towards one common goal. Benefits of the Arkieva Demand Planner Solution: 15% less inventory 17% higher perfect order ...Forecast Methods
Introduction To create a custom method to be used in the Statistical Forecast component, click the New button located in the Forecasting Methods ribbon. The new method with the name 'New Method' will appear under the Custom Methods category. Under ...